If you are a NetApp presales SE working for NetApp or a reseller, or simply an IT consultant working onsite (customer) trying to procure & deploy a NetApp enterprise SAN storage system as a part of an IT solution, one of the hardest things you’d have to do is to figure out how big you’d need to make the SAN in order for it to last a decent while without having to upgrade it to something bigger and better few months down the line. An accurate sizing is an extremely important part that you must pay enough attention to upfront to scientifically finalise the size & the specification of your new SAN, based on the workload your going to put on it. This is simply so that you procure a SAN storage that’s fit for purpose from capacity & throughput perspective so you wont have to look at adding additional nodes prematurely to your storage cluster too early in its life cycle.
Being involved as a channel SE, I go through this process day in and day out with my customers and the hardest part that usually gets in the way of doing an accurate sizing (apart from the impatient customer and the even more impatient sales guy who prefers to use the art of guessing to quickly come up with a “SAN configs that he can quote quickly for the customer”) is the lack of readily available storage statistics of the existing environment or the inability to effectively gather these storage stats from a distributed IT environment without laborious & time consuming tasks that involve lot of work with spreadsheets (I can imagine all NetApp SE’s nodding their heads in agreement right now 🙂 ). So far, a typical NetApp / Channel partner SE proposing a NetApp SAN solution for a customer, who’s supposed to be doing it properly would have had to ask the customer to provide storage stats for all of their estate (which almost always does not exist) or deploy a rudimentary monitoring and statistics gathering tool like virtualisation data collector (you need to be a NetApp partner with appropriate access to click on the link) and do lot of manual spreadsheet related work to manipulate the rudimentary data gathered before it can be fed in to SPM (NetApp’s official sizing tool) to produce a valid SAN storage configs for the given requirement. Having done this repeatedly myself for every single storage solution for my customers, I can say it has been painful and often very time consuming.
Like me, if you are involved in lot of NetApp SAN storage sizing for various customers, you’d be really glad to know that there’s a new data collection tool been made available called NetApp Lanamark (HPAS). NetApp Lanamark is a lightweight, agentless data collector that is fundamentally very similar to how VMware capacity planner (and its data collector) works. NetApp Lanamark lets you deploy a single data collector on to a Windows server (could be a VM) and monitor and continuously collect resource utilisation statistics (mainly storage) which is uploaded to a central repository online. Once sufficient data has been collected, you can run an assessment (unlike VMware cap planner assessment which is little complicated to actually get setup initially and configure an assessment, all of that are automatically done for you, so all you really need to do is to create groups of servers if required) and export the results in the form of a JSON file that can directly be imported in to SPM (NetApp’s formal sizing tool) and voila… you have an accurately sized SAN configuration that can be sent to the customer….Its that simple.
Given below are some key points to note
- It is supported to collect performance stats from a variety of host system OS’s such as (collecting data from none host systems such as arrays is not supported),
- Most Windows versions
- Following Linux versions (CentOS 3.x, 4.x, 5.x, 6.x, Debian 3.1, 4.0, 5.0, Fedora 4 – 10, Novell SUSE Linux Enterprise 9.x, 10.x, openSUSE 10.x, 11.x, Oracle Linux 4, 5, Red Hat Enterprise Linux 3.x, 4.x, 5.x, 6.x, Ubuntu 6 and up)
- Though its officially not listed, when I trialled this, it successfully connected to my ESXi (5.5) servers and collected data from them too. But note that later on when you run the assessment, the stats for these servers seems to get omitted (when I trialled this in my lab, it seemed to omit all the stats for the ESXi hosts)
- Each collector can gather data from <=2500 servers / systems
- Stats collected are uploaded to a data warehouse server in US
- Only available to NetApp employees or Start and Platinum partner SE’s (everyone else, you’d have to ask your NetApp SE to do this on your behalf)
- If you are a NetApp SE or a partner SE, more details can be found on the live presentation that can be found here
I’ve attempted a simple assessment using my home lab and given below are the typical setup steps involved.
- Go to https://lanamark.netapp.com and register a new opportunity (need a NetApp NOW account to login with. NetApp SE’s, Distribution SEs, Platinum or Start partner SE’s have rights to use this. If you are a different partner level, you need to request the aligned NetApp SE to do this on your behalf. Your NetApp CDM or the sales rep involved from NetApp in the opportunity also need to authorise the assessment. Anyone with a @netapp.com email address could usually do this)
- Once this is done, the designated customer contact receives and email with a link to download the data collector install with all the customer specific information is hard coded (no need to register collector ID’s with the online repository unlike the VMware cap planner for example). If you prefer to do this your self, you can too as the NetApp / Partner SE.
- Once the collector is installed, you configure the collector with the list of servers and the appropriate credentials for each server being monitored as illustrated in the screenshot below.
- Once the systems have been fed in to the collector (in the form of an IP range, csv file….etc) and relevant credentials have been associated, it will automatically inventory each server and start collecting statistics which are uploaded once a day by default to the NetApp Lanamark Central online repository which you can view as the SE via http://lanamark.netapp.com
- Double click on the assessment / engagement to view the details.
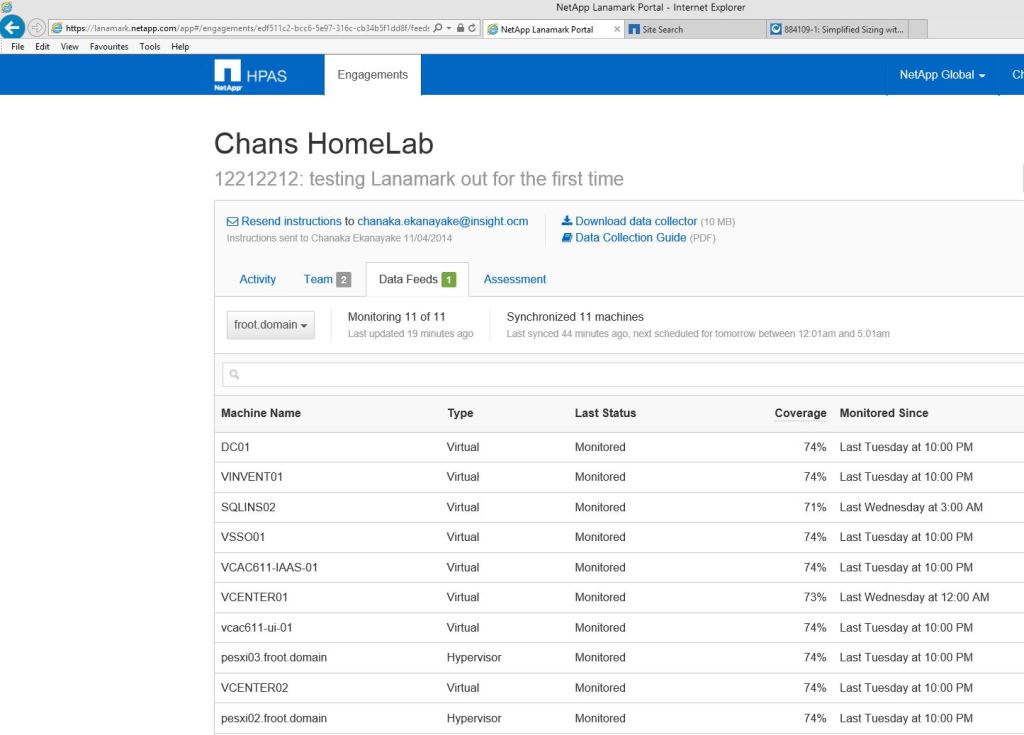
- Data feeds tab shows all the hosts that are being monitored and their monitored status
- The Assessment tab shows the summary of all the data collected that are ready to be imported in to SPM (NetApp System Performance Modeller = Official NetApp Sizing tool for all FAS and E series arrays).
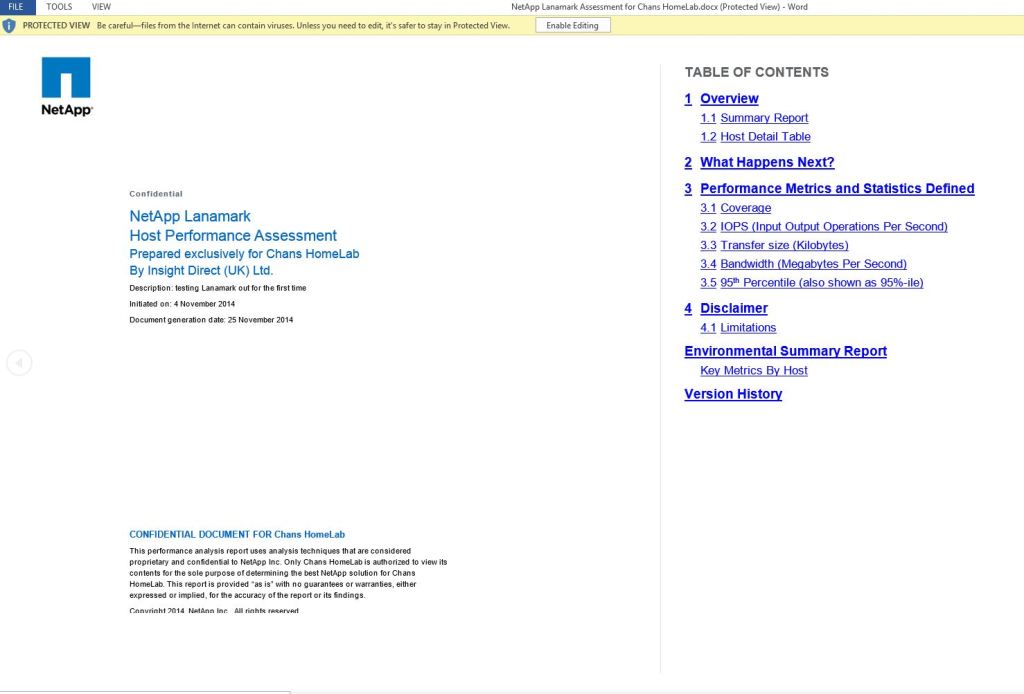
- On the top right hand corner of the assessment window, you have an option to generate a summary report which will produce a docx (Microsoft Word) document with all statistics data pre populated. This is quite handy if you are a vendor / partner SE who wants to present the findings in a formal manner through a proposal….etc.
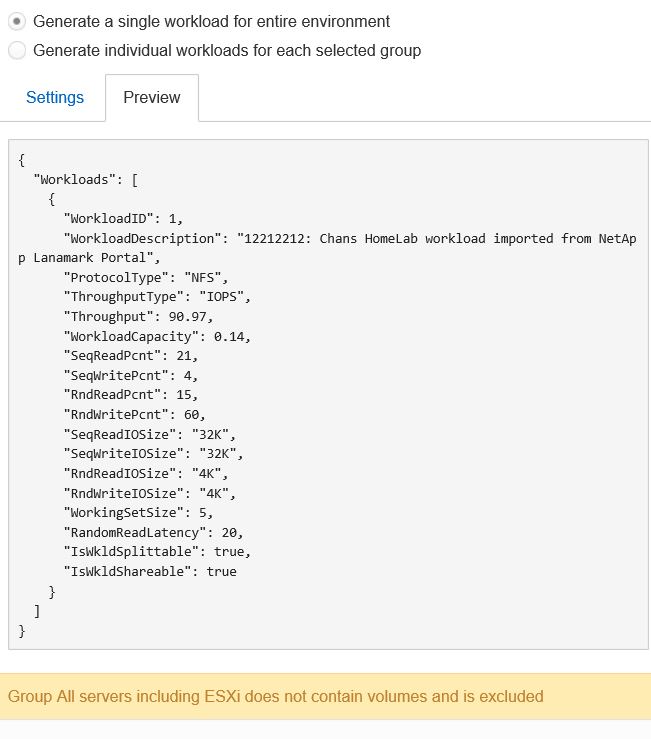
- The SPM export button create a .JSON file (sample shown below) which you can directly import in to SPM during sizing (no more laborious spreadsheet jobby’s 🙂 )
That’s, it…. Its that simple…..!!
Would be good to hear from others who’s already been using it out in the field to sizing new NetApp systems (comments are welcome..!)
Thanks to Bobby Hyam (NetApp SE) & Craig Menzies (EMEA Partner manager) from NetApp for providing the links to the presentation & Info….!!
Cheers
Chan


