Some of you may have seen the tweets and the article from legendary Duncan Epping here about the release of the new VMware VSAN plugin for vROPS (vRealize Operations Management Pack for vSAN version 1.0)
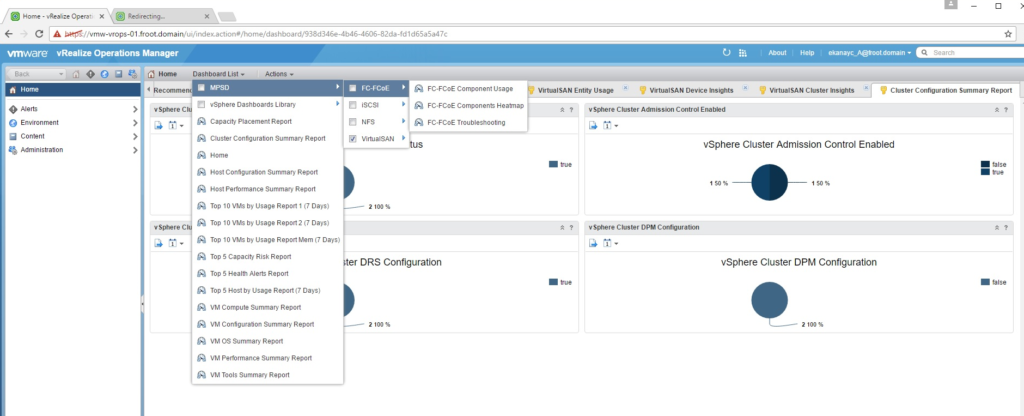
If you’ve ever had the previous VSAN plugin for vROps deployed, you might know that it was not a dedicated plugin for VSAN alone, but was a vRealize Operations Management Pack for Storage Devices as a whole which included not just the visibility in to VSAN but also legacy storage stats such as FC, iSCSI and NFS for legacy storage units (that used to connect to Cisco DCNM or Brocade Fabric switches).
This vROps plugin for vSAN however is the first dedicated plugin for VSAN (hence the version 1.0) on vROps. According to the documentation it has the following features
- Discovers vSAN disk groups in a vSAN datastore.
- Identifies the vSAN-enabled cluster compute resource, host system, and datastore objects in a vCenter Server system.
- Automatically adds related vCenter Server components that are in the monitoring state.
How to Install / Upgrade from the previous MPSD plugin
- Download the management pack (.pak file)
- Login to the vROps instance as the administrator / with administrative privileges and go to Administration -> Solutions
- Click add (plus sign) and select the .Pak file and select the 2 check boxes to replace if already installed and reset default content. Accept any warnings and click upload.

- Once the upload is complete and staged, verify the signature validity and click next to proceed

- Click next and accept the EULA and proceed. The management plugin will start to install.
- Now select the newly installed management plugin for VSAN and click configure. Within this window, connect to the vCenter server (cannot use previously configured credentials for MPSD). When creating the credentials, you need to specify an admin account for the vCenter instance. Connection can be verified using the test button.

- Once connected, wait for the data collection from VSAN cluster to complete and verify collection is showing

- Go to Home and verify that the VSAN dedicated dashboard items are now available on vROps

- By Default there will be 3 VSAN specific dashboard available now as follows under default dashboards
- vSAN Environment Overview – This section provide some vital high level information on the vSAN cluster including its type, total capacity, used, any congestion if available, and average latency figures along with any active alerts on the VSAN cluster. As you can see I have a number of alerts due to using non-compliant hardware in my VSAN cluster.

- vSAN Performance
- This default dashboard provide various performance related information / stats for the vSAN cluster rand datastores as well as the VM’s residing on it. You can also check performance such as VM latency and IOPS levels based on the VM’s you select on the tile view and the trend forecast which is think is going to be real handy.

- Similarly, you can see performance at vSAN disk group level also which shows information such as Write buffer performance or Reach cache performance levels, current as well as future forecasted levels which are new and were not previously accessible easily.

- You can also view the performance at ESXi host level which shows the basic information such as current CPU utilisation as well as RAM including current and future (forecast) trend lines in true vROps style which are going to be really well received. Expect the content available on this ppage to be significantly extended in the future iterations of this mgmt. pack.

- This default dashboard provide various performance related information / stats for the vSAN cluster rand datastores as well as the VM’s residing on it. You can also check performance such as VM latency and IOPS levels based on the VM’s you select on the tile view and the trend forecast which is think is going to be real handy.
- Optimize vSAN Deployments – This page provide a high level comparison of vSAN and non vSAN enviorments which would be especially handy if you have vSAN datastores alongside traditional iSCSI or NFS data stores to see how for example, IOPS and latency compares between VM’s on VSAN and an NFS datastore presented to the same ESXi server (I have both)

- vSAN Environment Overview – This section provide some vital high level information on the vSAN cluster including its type, total capacity, used, any congestion if available, and average latency figures along with any active alerts on the VSAN cluster. As you can see I have a number of alerts due to using non-compliant hardware in my VSAN cluster.
- Under Environment -> vSAN and Storage Devices, additional vSAN hierarchy information such as vSAN enabled clusters, Fault domains (if relevant), Disk groups and Witness hosts (if applicable) are now visible for monitoring which is real handy.

- In the inventory explorer, you can see the list of vSAN inventory items that the data are being collected for.

All in all, this is a welcome addition and will only continue to be improved and new monitoring features added as we go up the versions. I realy like the dedicated plugin factor as well as the nice default dashboards included with this version which no doubt will help customers truly use vROps as a single pane of glass for all things monitoring on the SDDC including VSAN.
Cheers
Chan
