vCenter Support Assistant 5.5.1.1

Just came across this nice virtual appliance & plugin to the vCenter web client that is free and sits along your vCenter and collect & send autosupport details to VMware (regular collecting of support bundles from vCenter and auto forward them to VMware for proactive support…. Seems to work Kind of similar to how NetApp Autosupport works in NetApp SANs)

Check it out

http://www.vmware.com/go/download-vcenter-support-assistant

more details to follow re installation and configuration.

NetApp Lanamark (HPAS)

If you are a NetApp presales SE working for NetApp or a reseller, or simply an IT consultant working onsite (customer) trying to procure & deploy a NetApp enterprise SAN storage system as a part of an IT solution, one of the hardest things you’d have to do is to figure out how big you’d need to make the SAN in order for it to last a decent while without having to upgrade it to something bigger and better few months down the line.  An accurate sizing is an extremely important part that you must pay enough attention to upfront to scientifically finalise the size & the specification of your new SAN, based on the workload your going to put on it. This is simply so that you procure a SAN storage that’s fit for purpose from capacity & throughput perspective so you wont have to look at adding additional nodes prematurely to your storage cluster too early in its life cycle.

Being involved as a channel SE, I go through this process day in and day out with my customers and the hardest part that usually gets in the way of doing an accurate sizing (apart from the impatient customer and the even more impatient sales guy who prefers to use the art of guessing to quickly come up with a “SAN configs that he can quote quickly for the customer”) is the lack of readily available storage statistics of the existing environment or the inability to effectively gather these storage stats from a distributed IT environment without laborious & time consuming tasks that involve lot of work with spreadsheets (I can imagine all NetApp SE’s nodding their heads in agreement right now 🙂 ). So far, a typical NetApp / Channel partner SE proposing a NetApp SAN solution for a customer, who’s supposed to be doing it properly would have had to ask the customer to provide storage stats for all of their estate (which almost always does not exist) or deploy a rudimentary monitoring and statistics gathering tool like virtualisation data collector (you need to be a NetApp partner with appropriate access to click on the link) and do lot of manual spreadsheet related work to manipulate the rudimentary data gathered before it can be fed in to SPM (NetApp’s official sizing tool) to produce a valid SAN storage configs for the given requirement. Having done this repeatedly myself for every single storage solution for my customers, I can say it has been painful and often very time consuming.

Like me, if you are involved in lot of NetApp SAN storage sizing for various customers,  you’d be really glad to know that there’s a new data collection tool been made available called NetApp Lanamark (HPAS). NetApp Lanamark is a lightweight, agentless data collector that is fundamentally very similar to how VMware capacity planner (and its data collector) works. NetApp Lanamark lets you deploy a single data collector on to a Windows server (could be a VM) and monitor and continuously collect resource utilisation statistics (mainly storage) which is uploaded to a central repository online. Once sufficient data has been collected, you can run an assessment (unlike VMware cap planner assessment which is little complicated to actually get setup initially and configure an assessment, all of that are automatically done for you, so all you really need to do is to create groups of servers if required) and export the results in the form of a JSON file that can directly be imported in to SPM (NetApp’s formal sizing tool) and voila… you have an accurately sized SAN configuration that can be sent to the customer….Its that simple.

Given below are some key points to note

  • It is supported to collect performance stats from a variety of host system OS’s such as (collecting data from none host systems such as arrays is not supported),
    • Most Windows versions
    • Following Linux versions (CentOS 3.x, 4.x, 5.x, 6.x, Debian 3.1, 4.0, 5.0, Fedora 4 – 10, Novell SUSE Linux Enterprise 9.x, 10.x, openSUSE 10.x, 11.x, Oracle Linux 4, 5, Red Hat Enterprise Linux 3.x, 4.x, 5.x, 6.x, Ubuntu 6 and up)
    • Though its officially not listed, when I trialled this, it successfully connected to my ESXi (5.5) servers and collected data from them too. But note that later on when you run the assessment, the stats for these servers seems to get omitted (when I trialled this in my lab, it seemed to omit all the stats for the ESXi hosts)
  • Each collector can gather data from <=2500 servers / systems
  • Stats collected are uploaded to a data warehouse server in US
  • Only available to NetApp employees or Start and Platinum partner SE’s (everyone else, you’d have to ask your NetApp SE to do this on your behalf)
  • If you are a NetApp SE or a partner SE, more details can be found on the live presentation that can be found here

I’ve attempted a simple assessment using my home lab and given below are the typical setup steps involved.

  • Go to https://lanamark.netapp.com and register a new opportunity (need a NetApp NOW account to login with. NetApp SE’s, Distribution SEs, Platinum or Start partner SE’s have rights to use this. If you are a different partner level, you need to request the aligned NetApp SE to do this on your behalf. Your NetApp CDM or the sales rep involved from NetApp in the opportunity also need to authorise the assessment. Anyone with a @netapp.com email address could usually do this)

Login screen

  • Once this is done, the designated customer contact receives and email with a link to download the data collector install with all the customer specific information is hard coded (no need to register collector ID’s with the online repository unlike the VMware cap planner for example). If you prefer to do this your self, you can too as the NetApp / Partner SE.
  • Once the collector is installed, you configure the collector with the list of servers and the appropriate credentials for each server being monitored as illustrated in the screenshot below.

Collector Screen

  • Once the systems have been fed in to the collector (in the form of an IP range, csv file….etc) and relevant credentials have been associated, it will automatically inventory each server and start collecting statistics which are uploaded once a day by default to the NetApp Lanamark Central online repository which you can view as the SE via http://lanamark.netapp.com

Landing Page


  • Double click on the assessment / engagement to view the details.

Screen 1

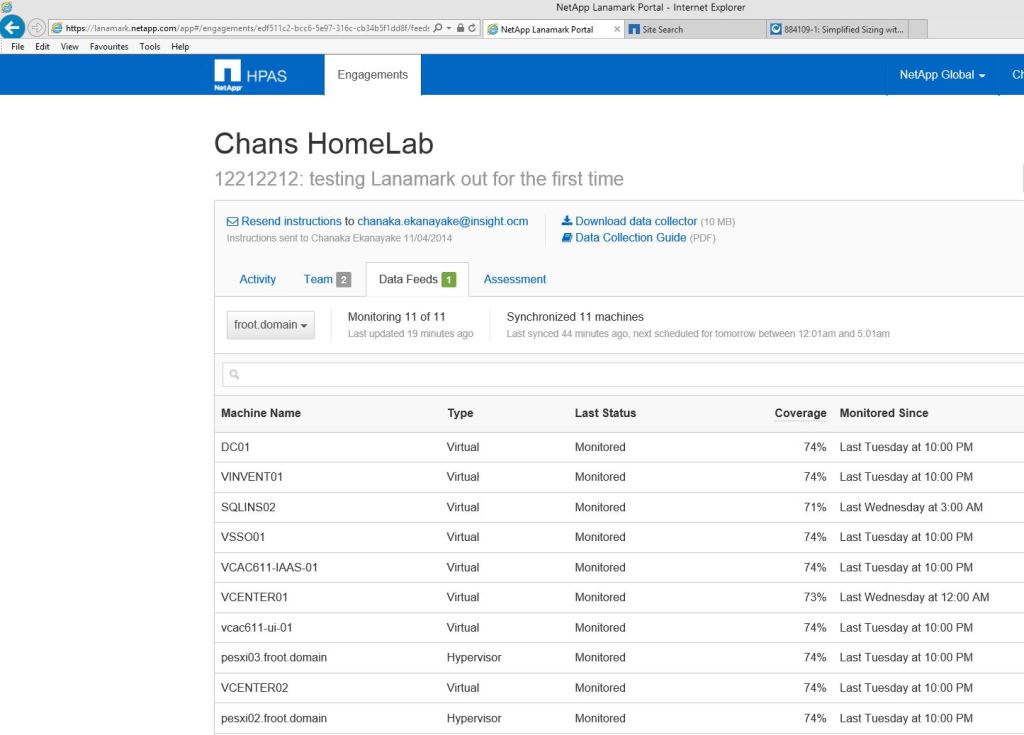
  •  Data feeds tab shows all the hosts that are being monitored and their monitored status

Data feeds tool

  • The Assessment tab shows the summary of all the data collected that are ready to be imported in to SPM (NetApp System Performance Modeller = Official NetApp Sizing tool for all FAS and E series arrays).

Assessment screen

Assessment screen 2


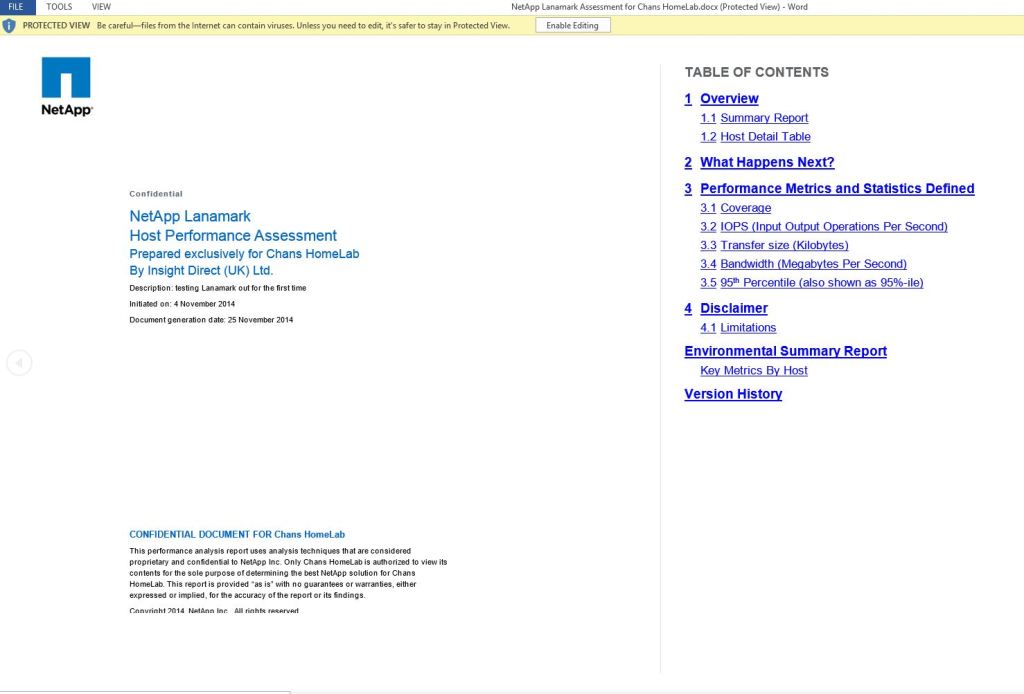
  • On the top right hand corner of the assessment window, you have an option to generate a summary report which will produce a docx (Microsoft Word) document with all statistics data pre populated. This is quite handy if you are a vendor / partner SE who wants to present the findings in a formal manner through a proposal….etc.

Summary Report

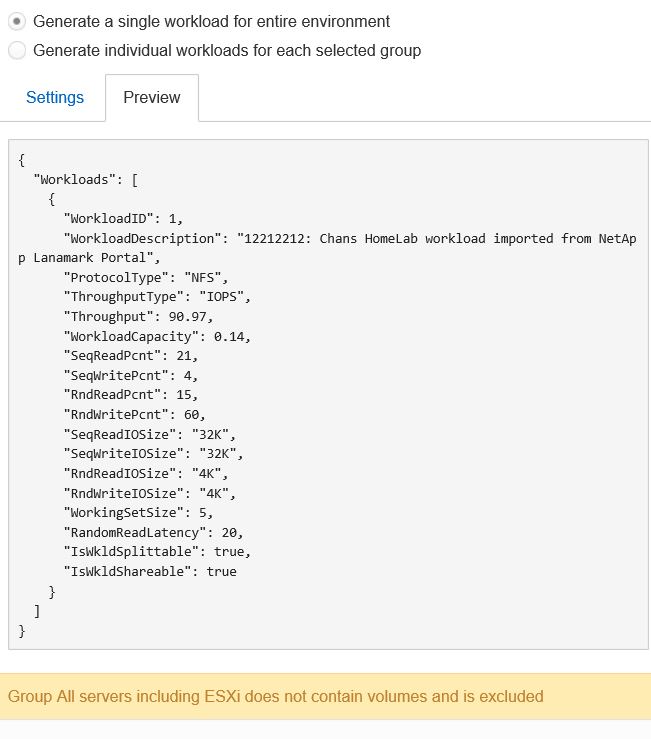
  • The SPM export button create a .JSON file (sample shown below) which you can directly import in to SPM during sizing (no more laborious spreadsheet jobby’s 🙂 )

JSON


SPM 1

SPM 2

That’s, it…. Its that simple…..!!

Would be good to hear from others who’s already been using it out in the field to sizing new NetApp systems (comments are welcome..!)

Thanks to Bobby Hyam (NetApp SE)  & Craig Menzies (EMEA Partner manager) from NetApp for providing the links to the presentation & Info….!!

Cheers

Chan

VMware Home Lab – New ESXi WhiteBox

I have a VMware Home Lab with 3 ESXi whiteboxes which is kind of the life blood of most of my VMware related studying and new product deployment experience.  As I’m in a presales role, I don’t often get to go out and deploy every single product I talk about in an enterprise IT environment everytime (I do limited deployment work every now and then) and having a decent lab where I can simulate an enterprise IT infrastructure where I can deploy any VMware (or any other part of the SDDC for that matter) is absolutely essential for me to function successfully in my job.  So, due of this necessity, I maintain my own lab in my little garage at home and currently I have 3 ESXi servers as follows

  • Dedicated Management cluster – 1 ESXi whitebox
    • 1 x Intel Xeon E3-1230 4C CPU @ 3.20GHz with HT (8 threads), 32 GB RAM, SuperMicro X8SIL motherboard, 1 x Dual port Intel 1000mbps NIC card
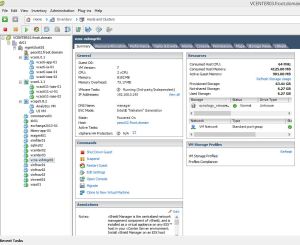
Mgmt Cluster

  • A Compute cluster – 2 ESXi whiteboxes
    • 1 x Intel Xeon X3450 4C CPU @ 2.67GHz with HT (8 threads), 32 GB RAM, Gigabyte Z68AP-D3 motherboard, 1 x Dual port Intel 1000mbps LOM
    • 1 x Intel Core i7 950 4C CPU @ 3.10 GHz with HT (8 threads), 32 GB RAM, Gigabyte motherboard, 1 x Dual port Intel NIC card
Compute Cluster

I also have a Synology 412+ as a shared SAN (iSCSI & NFS – in VMware’s HCL also) and a Cisco 3560G Gigabit switch -L3 enabled for storage and networking

As you can see, my management cluster is jam packed with lots of VM’s some of which have large resource assignments (i.e. vCops VM’s are 8GB each). There’s heavy ballooning happening already and that was even after I’ve had to shut some VM’s down temporarily (I don’t like to keep key VM’s powered down, I’d like them to be running 24×7 to pretty much simulate a real production behaviour).

Mgmt Cluster Memory Util

When I deploy new VMware products, I usually deploy them in a distributed architecture rather than the default all in one server kinda way to simulate a enterprise scalable deployment and this is obviously sucking up lot of resources, mainly memory in my poor 1 server management cluster. Add on top, things like VMware vCAC and NSX demanding dedicated management clusters, its obvious that I need to increase the resources within this cluster ASAP.

So, time to add a new ESXi host to the management cluster….

I’ve been looking around a lot and doing some research in to the options I have available, I’ve considered buying a OEM server (HP and Dell has few SMB servers for reasonable prices) but whats obvious is while the initial server within a minimum spec seems cheap enough, the moment you wanna add some memory to make it useful, the costs jump up massively (nice try HP & Dell…!!)

So, similar to the existing boxes I’ve decided to build another whitebox…. Having done some research, I’ve come up with the following key components as the best fit for a reasonable cost… I will aim to justify why for each item

  • Intel Xeon E5-2620 V2 (Ivy Bridge EP) – Cost around £300
    • Justification: The most important thing this gives me is the thread count. Its a 6c CPU with HT, giving me a total of 12 threads which is great for more VM’s. And its not badly priced compared to other options available. I did look at the Intel core i7’s again (which is also in the VMware HCL) but none (recent models) comes with more than 4 cores which potentially limit my VM density. Core i7 extreme would have been an option but the price and the age ruled that out. Xeon E3 were also limited to 4 cores and the E7’s were astronomically expensive for a Home Lab so no go there. Xeon E5 seemed to be the best option available and E5 version 2 processors seems to strike the best balance between the core count & core speed & the cost. The one I’ve chosen, E5-2620 V2 has the best mix and a very low price. If you are concerned about the power usage, its got one of the lowest TDP (Thermal Design Power) requirement which is 80W.
  • MSI X79A-GD65 (8D) Motherboard – Cost around £160
    • This was a key part of the system and I settled for a single socket motherboard but the most important requirement was that it had the memory scalability up to 64GB (which this does thanks to the 8 DIMM slots). The Intel X79 chipset has built in RAID (AHCI) is great as it enables vSAN support (ESXi 5.5 U2 has AHCI drivers) so I can test that out too.
  • 64GB RAM (non ECC) – Cost around £340
    • This was just easy. I needed as much ram as I could get in for a reasonable cost and non ECC was obviously cheaper. Would have preferred to have got 128GB ram but I felt the cost was a little too high.

I initially spent quite a lot of time looking at the inter-compatibility of the components the hard way by reading the documentation for each components before accidentally coming across the site http://pcpartpicker.com/. This site was brilliant in that you can start of with, say the CPU and it will automatically show you what other components are compatible with it so you can select from a pre-vetted compatible list of components. Once you select an item it also show you various prices for each item from a multiple of online sources that you can directly jump to if you wanna order (I did search for pricing outside of the listing given by the site to double check and most of the ones were cheaper through the sources suggested through this site.

If you wanna see the complete build of my Whitebox, see the link below where it let you publish the full configs and the approximate cost based on the cheapest available online (which was pretty accurate) – All for under £1000 which wasn’t too bad in my case.

http://uk.pcpartpicker.com/user/chanakaek/saved/qbgZxr

Whitebox build & cost

I think this site is awesome and hopefully would help you quite easily build your own whitebox if you need it. There’s a US, UK, Australia and few other countries version of this site available so it uses local suppliers for costs calculations.

Note: I bough my case from elsewhere though as I needed a rack mount server case and I’d bought the same before for my existing servers. That can be found here.

Hopefully this was useful if you are planning to build your own ESXi whitebox.

Also, have a look at the Frank Denneman’s blog about his Home Lab here, I think the motherboard he’s used is pretty awesome with the built in 10gbe ports and memory scalability up to 128GB

Cheers

Chan

vCAC 6.1 secondary DEM Orcehstrator and Worker installation error (Error 3: -2147287038)

Just thought I’d share a peculiar error I’ve been getting while trying to deploy a second DEM Orchestrator / Worker component as a part of a redundant vCAC server deployment…..

I have a single IAAS server that was installed with the Model manager service and the default DEM Orchestrator (Active) and a DEM worker in one server and wanted to deploy a second instance of DEM Orchestrator (passive) and an additional DEM worker as per VMware best practise, on a separate IAAS server VM. (VMware best practise is for more than 1 DEM orchestrator to be deployed along with additional DEM workers). In order to achieve this, I was attempting a custom install of the IAAS setup where only the Distributed Execution Manager components were selected but the installation kept failing with the following error message every time despite all the pre-req’s being in place….. (Even the verification is passed successfully as shown below)

DEM_Error_1

Error message below

DEM_Error_2

I haven’t been able to find any KB articles from VMware with regards to this issue or how to fix it so having had a boring read through the install log, you can see the following lines with error codes (amongst other things – see the bold text)

  • MSI (s) (10:70) [02:01:17:654]: Note: 1: 2262 2: Error 3: -2147287038
  • Error executing: C:\Program Files (x86)\VMware\vCAC\Distributed Execution Manager\DEM2\RepoUtil.exe Model-Config-Import -c “C:\Program Files (x86)\VMware\vCAC\Distributed Execution Manager\DEM2\DEMSecurityConfig.xml” -v
    Error importing security config file DEMSecurityConfig.xml. Exception: System.Data.Services.Client.DataServiceTransportException: The underlying connection was closed: Could not establish trust relationship for the SSL/TLS secure channel. —> System.Net.WebException: The underlying connection was closed: Could not establish trust relationship for the SSL/TLS secure channel. —> System.Security.Authentication.AuthenticationException: The remote certificate is invalid according to the validation procedure.  ——————————–
  • DynamicOps.Tools.Repoutil.Commands.ModelConfigImportCommand.Execute(CommandLineParser parser)Warning: Non-zero return code. Command failed.
    CustomAction RunRepoUtilCommandCA returned actual error code 1602 (note this may not be 100% accurate if translation happened inside sandbox)
    Action ended 02:01:48: InstallFinalize. Return value 2.

Turned out that this happens primarily due to the fact that my primary IAAS server’s default SSL certificate (self signed) not being trusted by the new server where I’m trying install the additional DEM components….

So the solution is  to manually import the certification from the primary IAAS server and add it to the certificate store of the new server first prior to attempting the install of the secondary DEM components.

You can grab the certificate from the primary IAAS server using the URL https://<FQDN of the primary IAAS server>/repository/Data/MetaModel.svc/

Make sure you import the certificate in to the Local Computer’s Certificate store and that you can see it under the Trusted Root Certificate Authorities…

Note to VMware: Perhaps you need to add a SSL certificate validation criteria to the Test option where this is checked properly within the initial screen???

See the screenshots below for guidance.

DEM_Error_3

DEM_Error_4

DEM_Error_5

DEM_Error_6

DEM_Error_7

Once the SSL cert is added to the second server, the additional DEM components gets installed successfully.

Cheers

Chan